Introduction
Visuals = Viral Lift
 You have all of your social and PR channels set up and a very tight editorial calendar with solid written content, but you are not getting into a dialog with your community nor are you getting the viral lift with the crucial following and sharing action? Visuals are the most effective way to get the engagement factor. They are highly consumable in a matter of seconds and they are highly sharable. And if your point of view is data-backed, there is no better way to express your findings than with an infographic.
Business Purpose
Visuals are Very Sharable
Viral, viral and viral – unlike direct marketing where you may have to purchase lists and possibly budget in print and mailing costs – the beauty of a well placed PR piece or social content is that you get that free viral lift. And you get a relevance filter as a bonus as your audience, or rather your community, only likes, shares and follows items that have relevance to them and their social community. Our clients up the engagement and viral factor with the Frame Concepts Social Media and PR Visual Solutions for a variety of reasons:
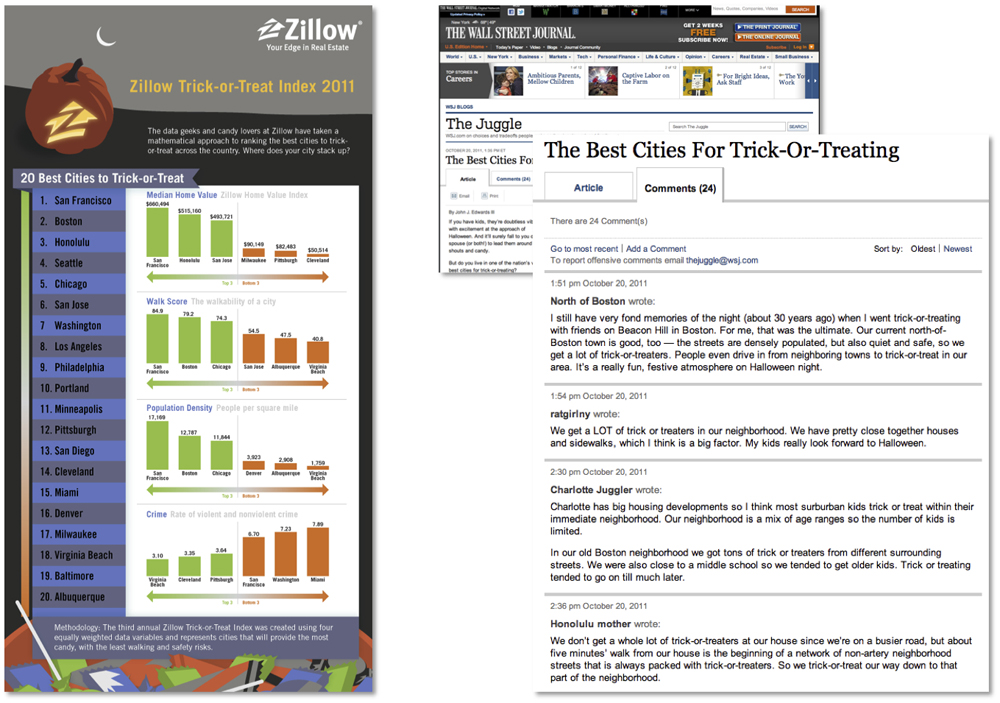
- Dense Long Written Blogs and Press Releases Do Not Engage – Lets just leave it at that.
- Community Engagement – You come with visual gifts with a provocative research-backed infographic that your audience wants to discuss and also wants to learn more about the author and their offerings.
- Entertainment– Its all about balance – the visuals put a smile on the face and they come to appreciate your point of view while also learning more about your position and your offerings in the marketplace.
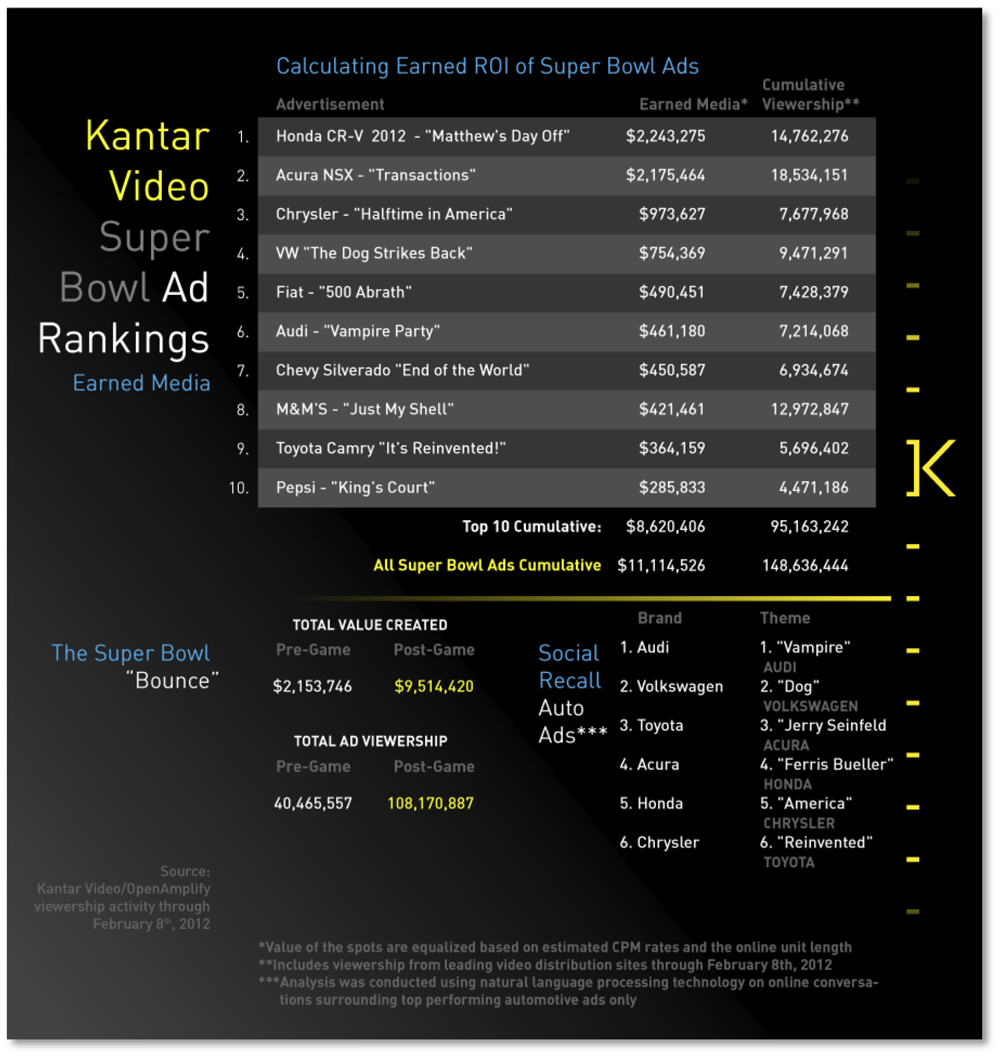
- Learning – Sometimes your offerings are so innovative you need to bring your audience along for the ride – boiling it down on a single page infographic gets them on your train.
- Identity and Retaining – Visuals coupled with facts and data stay in the memory banks longer and the visual identity makes it easier for them to refer to your post when they communicate with their peers.
Showcase
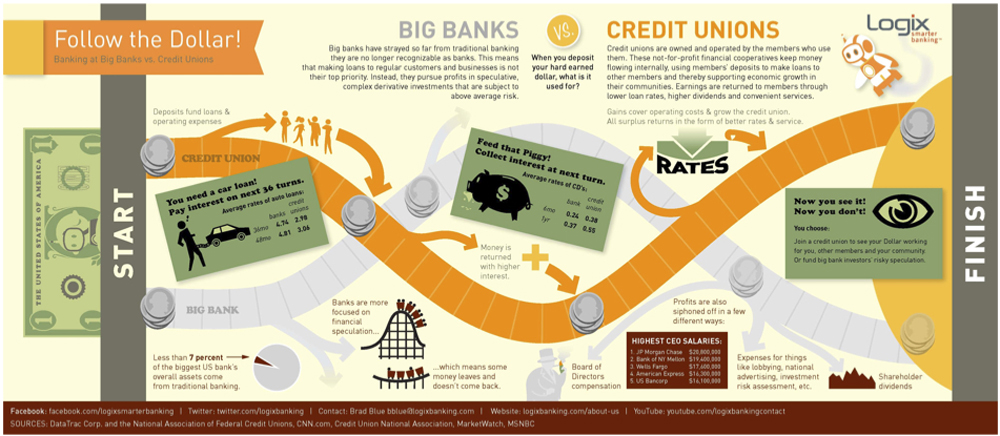
New Name for California Credit Union Calls for a New Infographic Social Media Play (click to expand)
More Examples
To see more samples of the Frame Concepts Social Media and Visual Solutions as well as other visual solutions, click here to view a sortable portfolio.