

Understanding and Engagement Visual Solution Needs Cut Across the Entire Organization
All Major Functional Departments are Embracing Visual Solutions for Communications
Well its was a bit of a hurdle four years ago when Frame Concepts started to get marketing divisions to embrace infographics, solution pictograms, infographic animations and data driven visualizations as part of their integrated go-to-market planning and NOT just the luxury of the publishing houses. And now we are happy to see that all the major functional departments are embracing integrated visual solutions for their communication plan.
But Are Not Visual Solutions Effective When There is a “Sell” Going On?
“If you can frame how people think about their problems, you’re half way to selling them.”Jakob Nielsen, the Usability Czar
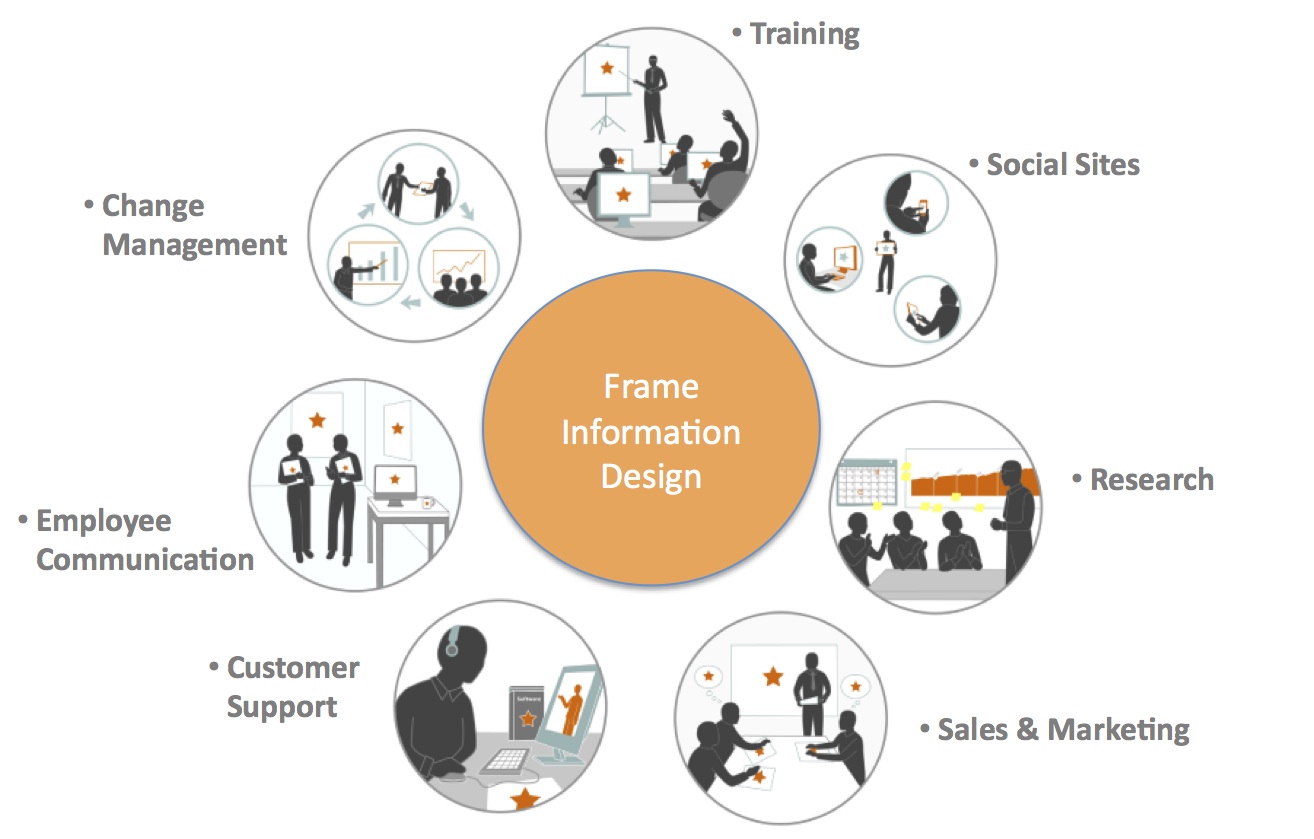
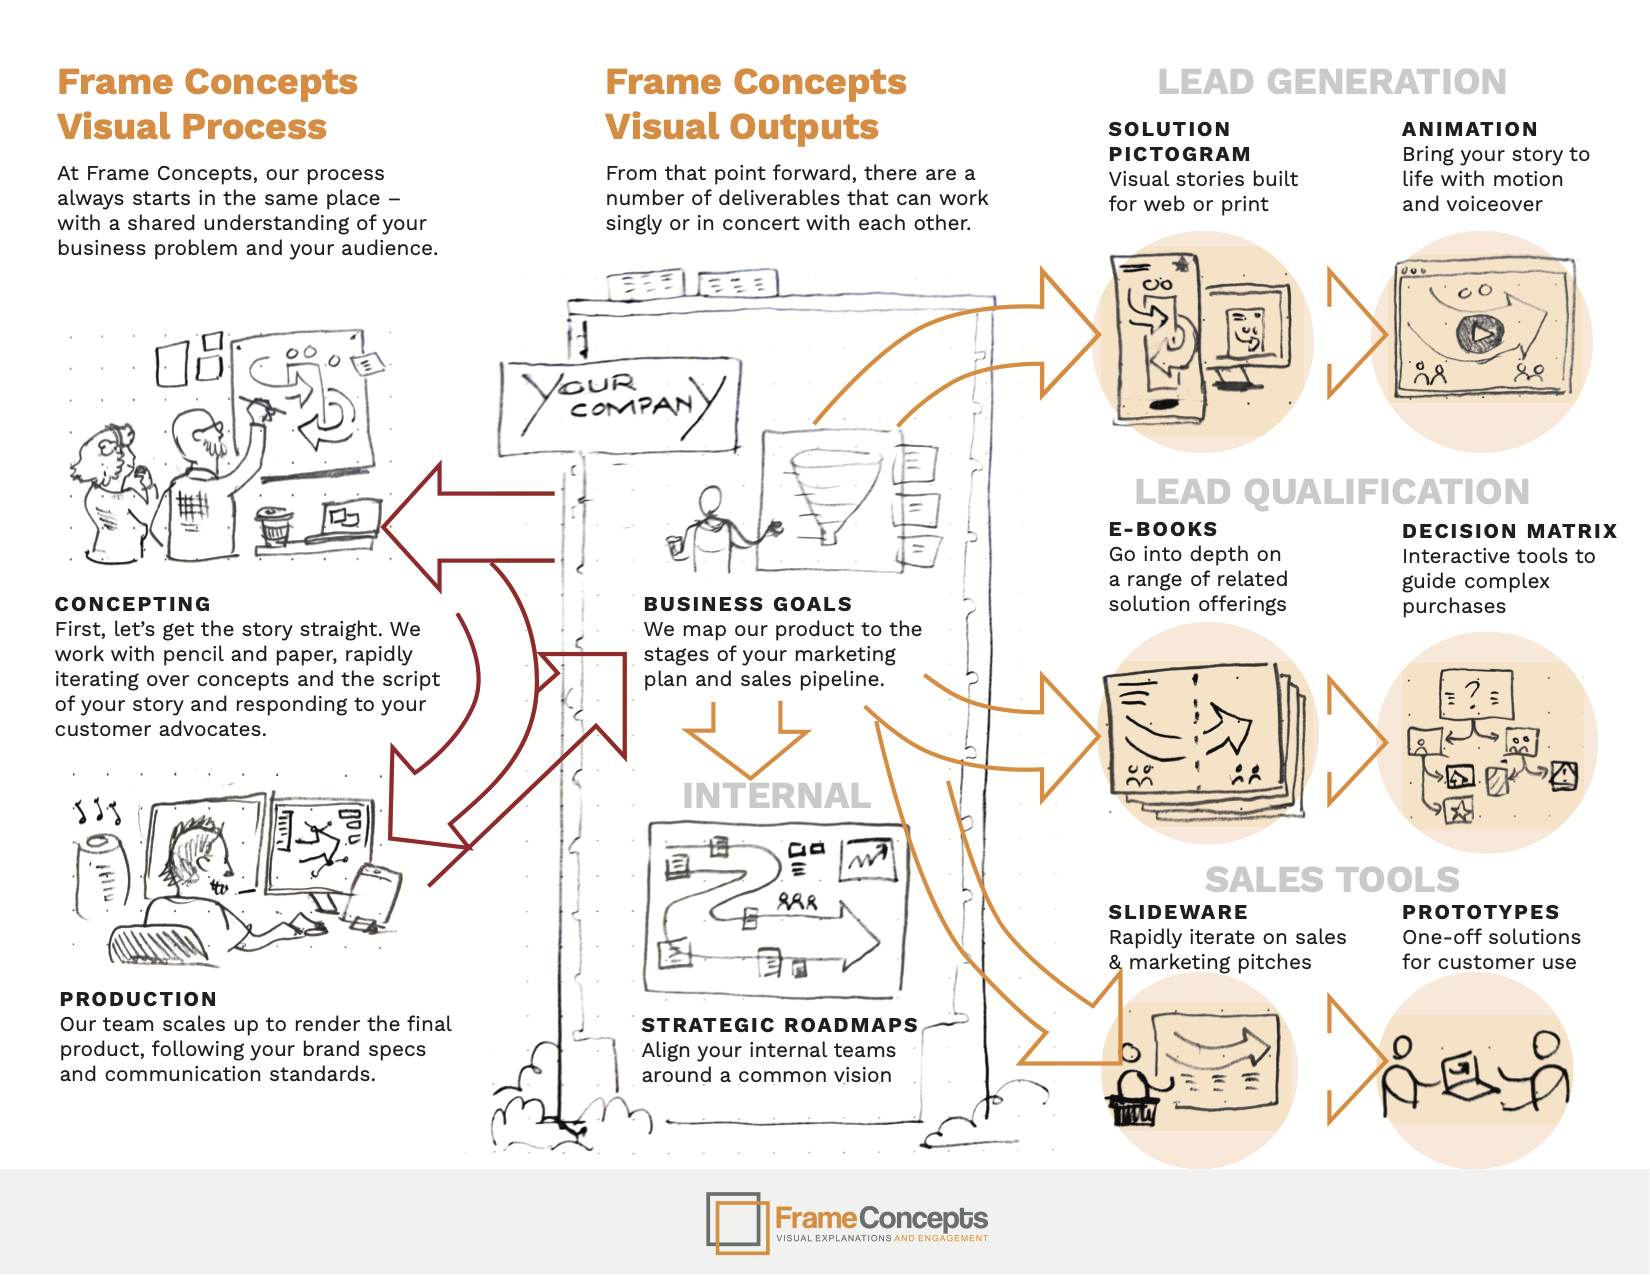
The Answer is “Yes” but their is an implicit suggestion that the “Sell” only occurs within the Sales and Marketing department. But we all know thats not true. If we reference the wheel diagram above and quickly tour through the major professions, we can easily identify the “sell” going on across the organization. Lets list them out:
- Training – trying to bring new employees into a new culture and practices or existing employees into new tools and processes – there is definitely a “sell” going on here as they were quite comfortable with the old approach and they are already overloaded with duties and besides we all know training is a waste of time right?
- Social Programs – well technically there is not suppose to be selling going on here – its all about authentic relationships and meaningful conversations – ANY social media program has targets over its head – followers, interactions, leads, etc – there is an implicit sell going on that is driving the business reason for the program to begin with.
- Research – the hallmark of pure facts with no “sell” correct? Well yes but Research is our second biggest form of business for our visual solutions. And behind the scenes our research clients complain ALL the time that nobody engages, appreciates the findings, even reads the report (even their own staff and CEO) and in short – nobody cares. Engagement is a HUGE problem. The fact our clients run infographics on top of the research signifies the attempt to bring in their audience – to help them engage and understand the points being made.
- Customer Support – Customer Support inherits all the “selling” going before the prospect became a customer and now has a question or issue for customer support. Meeting retention goals involve selling and customer service does well to embrace the visual solutions to continue the value proposition – the promise of quality services by making sure their client on each service interaction “gets it”.
- Employee Communications – anyone who has been on the receiving end of a company town hall meeting senses the “sell” going on and is worries about what impact the latest communication is going to have on their day-to-day or perhaps their job. Its amazing with the entire company “spirit”on the line that more organizations don’t help them with engaging, clear visual explanations.
- Change Management – If you are a change management agency, there is a long sales cycle typically to close the deal – but their is a huge sell to the employee base once change is going to be implemented. The staff are inherently suspicious of any recommendations from management or worse – an agency from the outside that does not appreciate the nuances of their business.
And Its Not Just the Sell – The Audience Appreciates the Effort
All of us in our respective professions know their are some magic moments – a key customer meeting, an important company announcement, a new product release – that you really, really, really need understanding and engagement. And the simple fact is that if you have done the work and come up with intuitive and engaging visual to explain the key point at hand – that the audience will be brought in. When they ask questions, they refer to the visual – in viewing the visual, hearing you talk about it, discussing it – its now become part of their understanding and now they are onboard piecing the challenge with you together. And on a simpler level they appreciate the effort that you take to get them onboard. They most certainly sense that YOU think this is a very important point and that commands their attention. And perhaps on a psychological level – the fact that the new solution, approach, idea has been visually codified and “published” suggests the new business train is moving forward and they need to get onboard for the exciting ride.
“Professional” Visual Solution Embracers Unite!
Well while I might be making arguments for visuals to be embraced across the organization, over the last four years, I am happy to report that from the wide range of visual solutions Frame Concepts delivers on a daily basis that I can turn more into a journalist than a defendant. I am constantly amazed how our clients (not Frame) sees our visual tool kit and case studies and portfolio and they come up with yet another application for the Frame “Lab” to deliver. This process is essentially our product development process. You can see the results of this creative interaction on our Visual Solutions and Case Studies Section of our website. And if a grid of icons representing visual case studies within professions, industries and organization types is suggestive of the visual movement in front of us, I will leave you with this picture:
![]()
If you would like to learn how the Frame Concepts Visual Solutions can enable understanding and engagement in your organization, click here for a Free Demo and Consultation.