


For years, link-bait has been the highest level of link-building available. There’s nothing better for increasing rankings than to have a viral piece of content spread throughout the internet, getting posted and reposted across a wide-array of websites, blogs, and social media sites.
Infographics have emerged in the last 3 years as the most valid form of link-bait. When website owners see an infographic they like that fits in with their niche, they will often look for and find the embed code on the page, copy, and post it on their site. It is within the embed code that the real “juice” of infographics happen.
It’s here where the magic occurs.
Links have been the dominant component of a strong SEO strategy for a while, now. Google and Bing look to outside signals about a site’s relevance as much if not more than all of the onsite signals combined. When a high-valued website links to yours, it acts in many ways as a vote in the eyes of the search engines.
Not all votes are created equal in the world of SEO, which is why infographics have acquired so much value. Getting an infographic posted on Mashable or FastCompany is much more valuable than buying a link from a spammy source, posting in hundreds of forums, or getting social bookmarks sent to a web site in bulk. The single link on these respected sites is better than a thousand links from link farms or spammy pages.
Here are the keys to infographic success as an SEO tool:
Include the Embed Code at the Source
If you don’t have an embed code, there’s a greater chance that website owners will post your infographic without a link to your site or simply pass up on posting it at all. Embed codes simplify the process and make it to where you’ll now have a better chance of getting the link and the post that you desire.
Look at this automotive marketing infographic. If you scroll down, you’ll see the embed code at the bottom of the page. To put that code in, we posted this code:
<div>
<font style=”font-weight:bold;font-size:14px;”>Embed this Image on Your Site:<br/></font>
<textarea rows=”4″ cols=”45″ onclick=”this.select();”><a href=”http://www.tkcarsites.com/automotive-marketing-pid18291″><img src=”http://soshable.com/wp-content/uploads/2011/05/Automotive-Industry-Infographic.jpg” alt=”Automotive Marketing” width=”600″ border=”0″ /></a><br />Via: <a href=”http://www.tkautomotiveseo.com”>Automotive SEO</a></textarea>
</div>
You can adjust the size, links, and alt tags to fit what you’re trying to accomplish with the infographic. When people find this code, all they have to do is paste it into their own posts in HTML mode and it will give them the infographic as well as giving you the links you need.
Keep in mind, there are actually two links in this example. The first link is the image link associated with the infographic. By applying an alt tag and linking it to one source (where the click to the image is supposed to go) a website owner will be able to get that inbound link wherever it is posted.
The second link is an actual text link at the bottom of the infographic. In reality, you can put more than one attribution link here. This is a good strategy if you have multiple sites you want to optimize through the infographic.
Go Big or Go Small – No In-Between

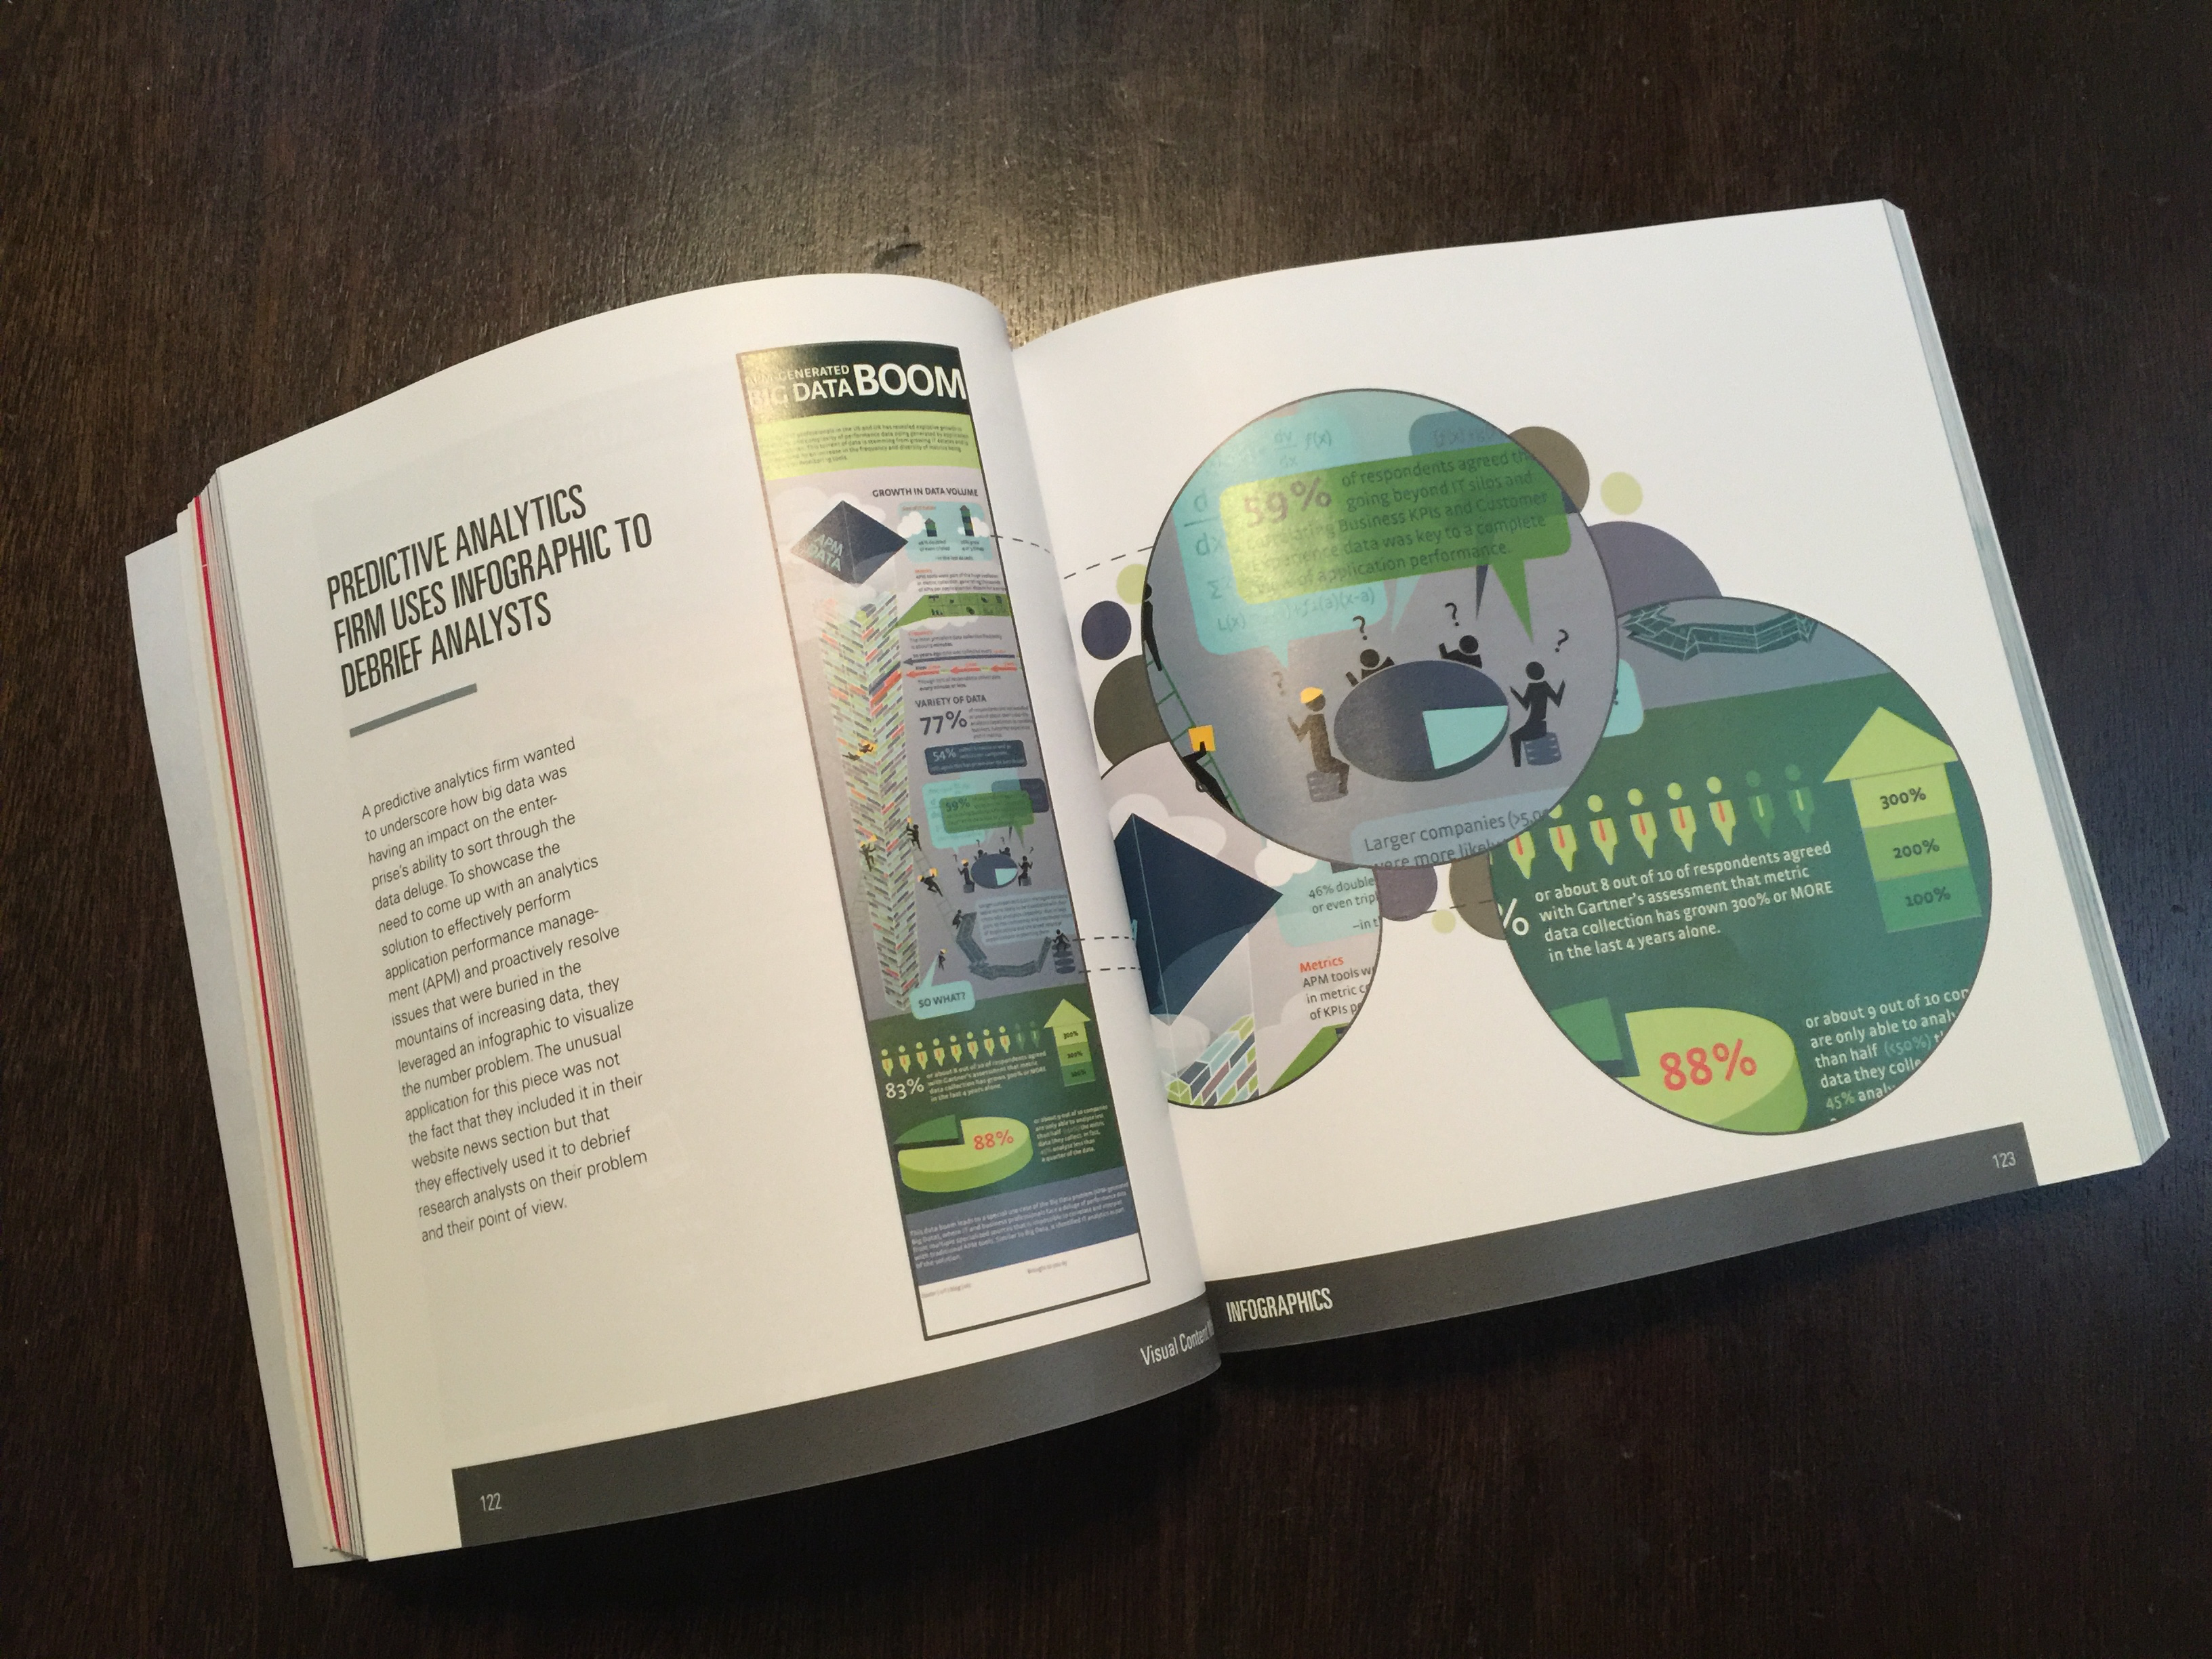
There are advantages to a large, robust infographic that spans well below the fold and encourages people to scroll all the way down. They are “stand alone” pieces of content that website owners and bloggers do not have to write a lot about to make them valid posts. They can write up a paragraph or two and let the information in the infographic do most of the talking.
In the example above, 1Bog chose to use a large infographic, which was posted by several sites, including Cincinnati Ford. As a result, they were able to get good placement and the posters didn’t have to write a ton to make the post valid.
A small infographic, one that fits nicely within the screen, also has advantages. It’s easier for website owners to scan for accuracy. Some won’t post large infographics because they don’t know the validity of all of the information and do not want to risk posting something erroneous on their site. Small infographics give them a starting point, a talking point around which they can craft a full story.
If an infographic is a “tweener” it will have less of a chance of getting posting. Something that is 1000px-wide by 2000px-long isn’t big enough to have a ton of information but is too big to be a simple starting point for the blogger.
Go all the way or keep it small. In between is simply less effective.
by JD RUCKER on NOVEMBER 11, 2011

