Introduction
The Energy Industry has Its Own Innovation Communication Challenges
 While traditionally the Energy Industry is seen as a commodity industry as opposed to the innovation paradigm that pervades the Technology and Startup industries – this is actually far from the case. With environmental concerns and a finite supply of fossil fuels and general concerns about sustainability, the Energy Industry has become the hallmark of innovation. And with innovation comes communication challenges. And of course this innovation has also to be translated in terms of delivered value which involves data-based research and technical features of the energy type being utilized. This is where the Frame’s Energy Industry Visual Solutions can help.
Business Purpose
Shake Up Stodgy Energy “Commodity” with Dynamic Visualizations
The Energy Industry, in delivering more effective approaches to energy solutions, must sure their marketplace understands and engages:
- Explaining Your Approach – A process pictogram can enable your audience to appreciate your process.
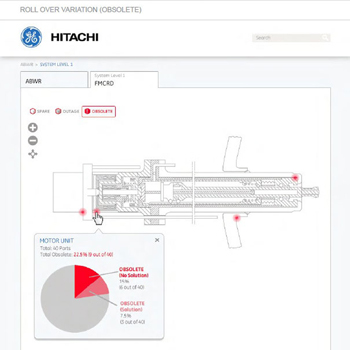
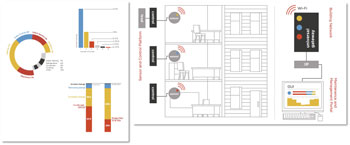
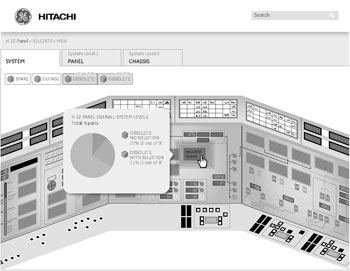
- Energy is Metrics-Driven – Data visualizations can make the complex intuitive.
- Energy has its own Vocabulary – Technical concepts need to by understood by your business buyer.
- Competitive Landscape – Sometimes the technical benefits of a particular energy source can be subtle – you need subtlety to stand out.
- Customer Communications – Ensure your customer appreciates the benefits of your service with something as simple as an intuitive form on a bill statement or offer a dynamic-data driven visualization to your business client.
- Showcase Your Innovation – Shake up stodgy energy connotations with a dynamic visualization of your innovative offerings.
Showcase


More Examples
To see more samples of the Frame Concepts Social Media and Visual Solutions as well as other visual solutions, click here to view a sortable portfolio.


