

The Challenge
Frame Concepts have created a number of infographics for our client D&B as well as data-driven visualizations like this historical global risk heat map. On this project however, D&B wanted to explore deeper understanding and engagement with their tried and true offering – the D-U-N-S number. What better way to explain this than through an infographic design.
With the D-U-N-S number D&B have cornered the market in terms of providing a unique identifier that provides businesses insight into the financial health (or lack thereof) of a company they may wish to do business with.
While it is very well known, the D-U-N-S number contains much deeper insights and a more complex underpinning than is commonly known. D&B wanted to shake the preconception that it’s a thin credit rating number for businesses.
The Solution
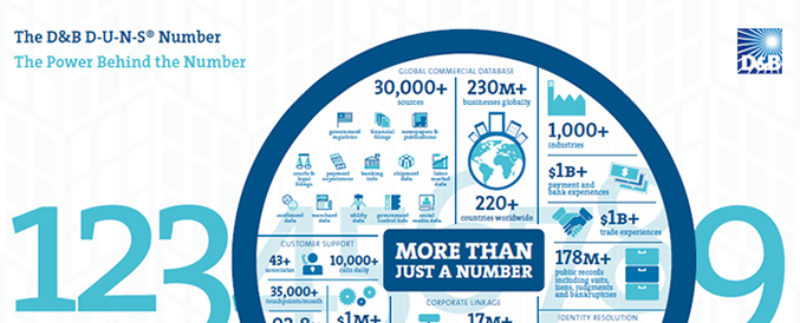
Armed with this information and reference materials that included the substantial rigor and breadth of dynamic data that feeds into the D-U-N-S number, we wanted to show the insights behind the number.
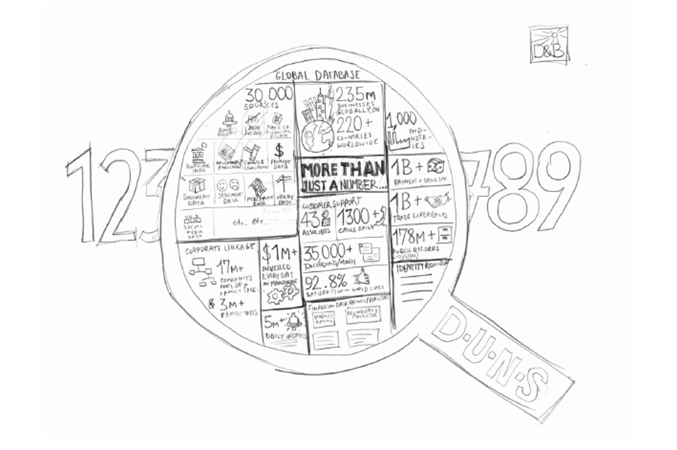
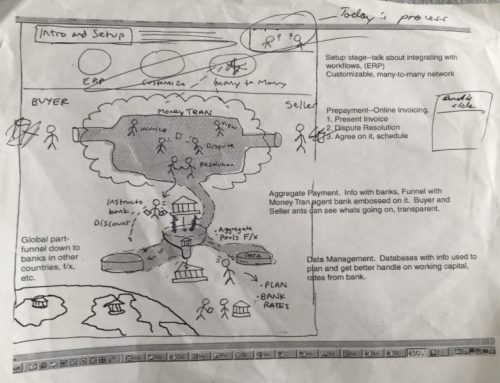
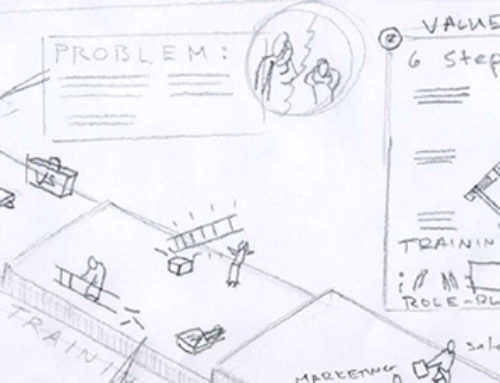
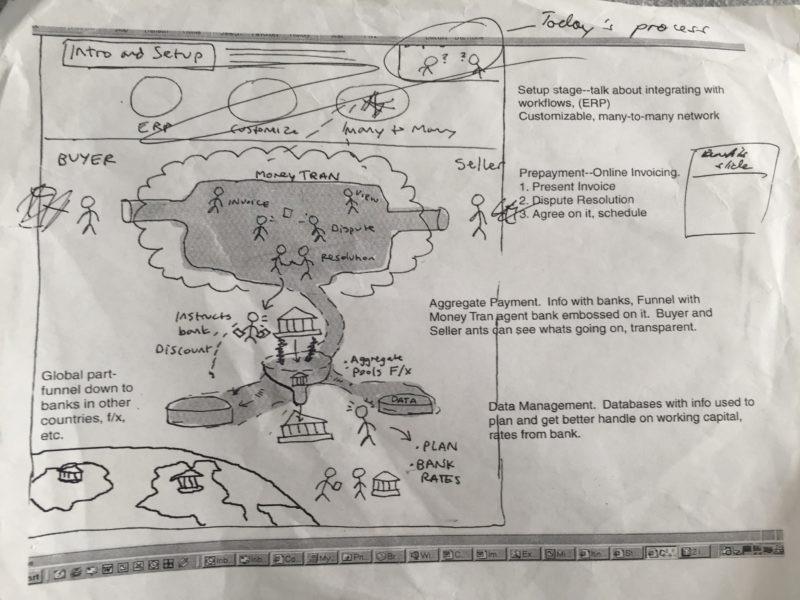
During the kickoff and ideation sessions and at the pencil sketch production phase, we came up with the concept of a magnifying glass that zeroed in on the D-U-N-S number – the star of the show – but also showed the detailed data and insights that were part of the D-U-N-S number offering.
Bringing it to Digital Life
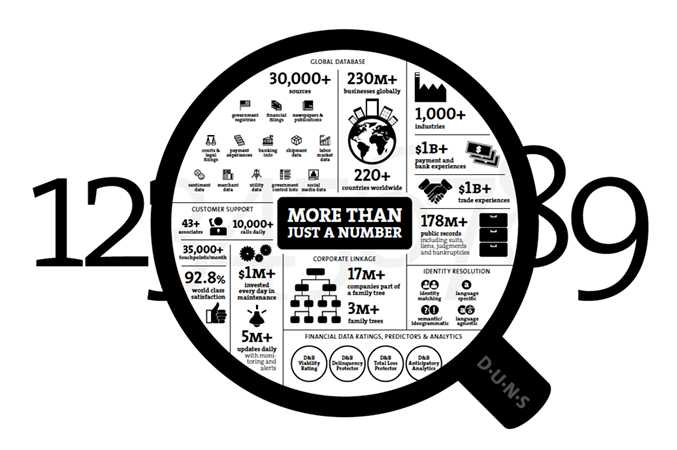
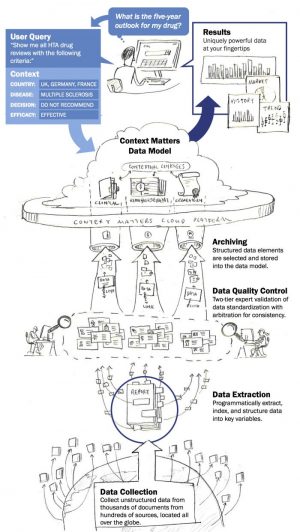
With magnifying glass concept approved – the next step is to open up Illustrator and create the digital version. Here is a full render without brand treatment:
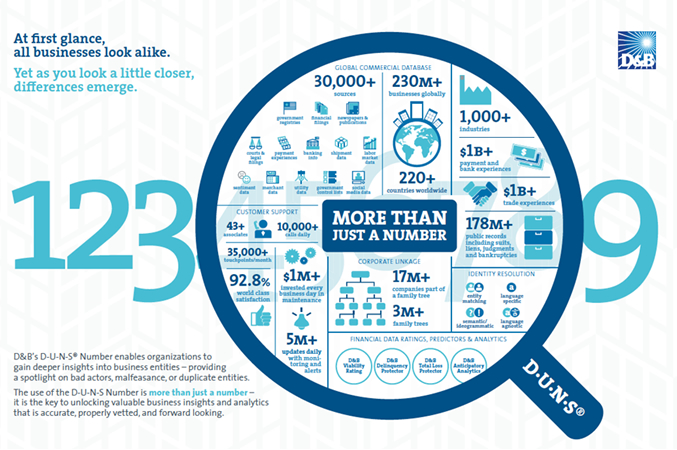
Letting the Brand In
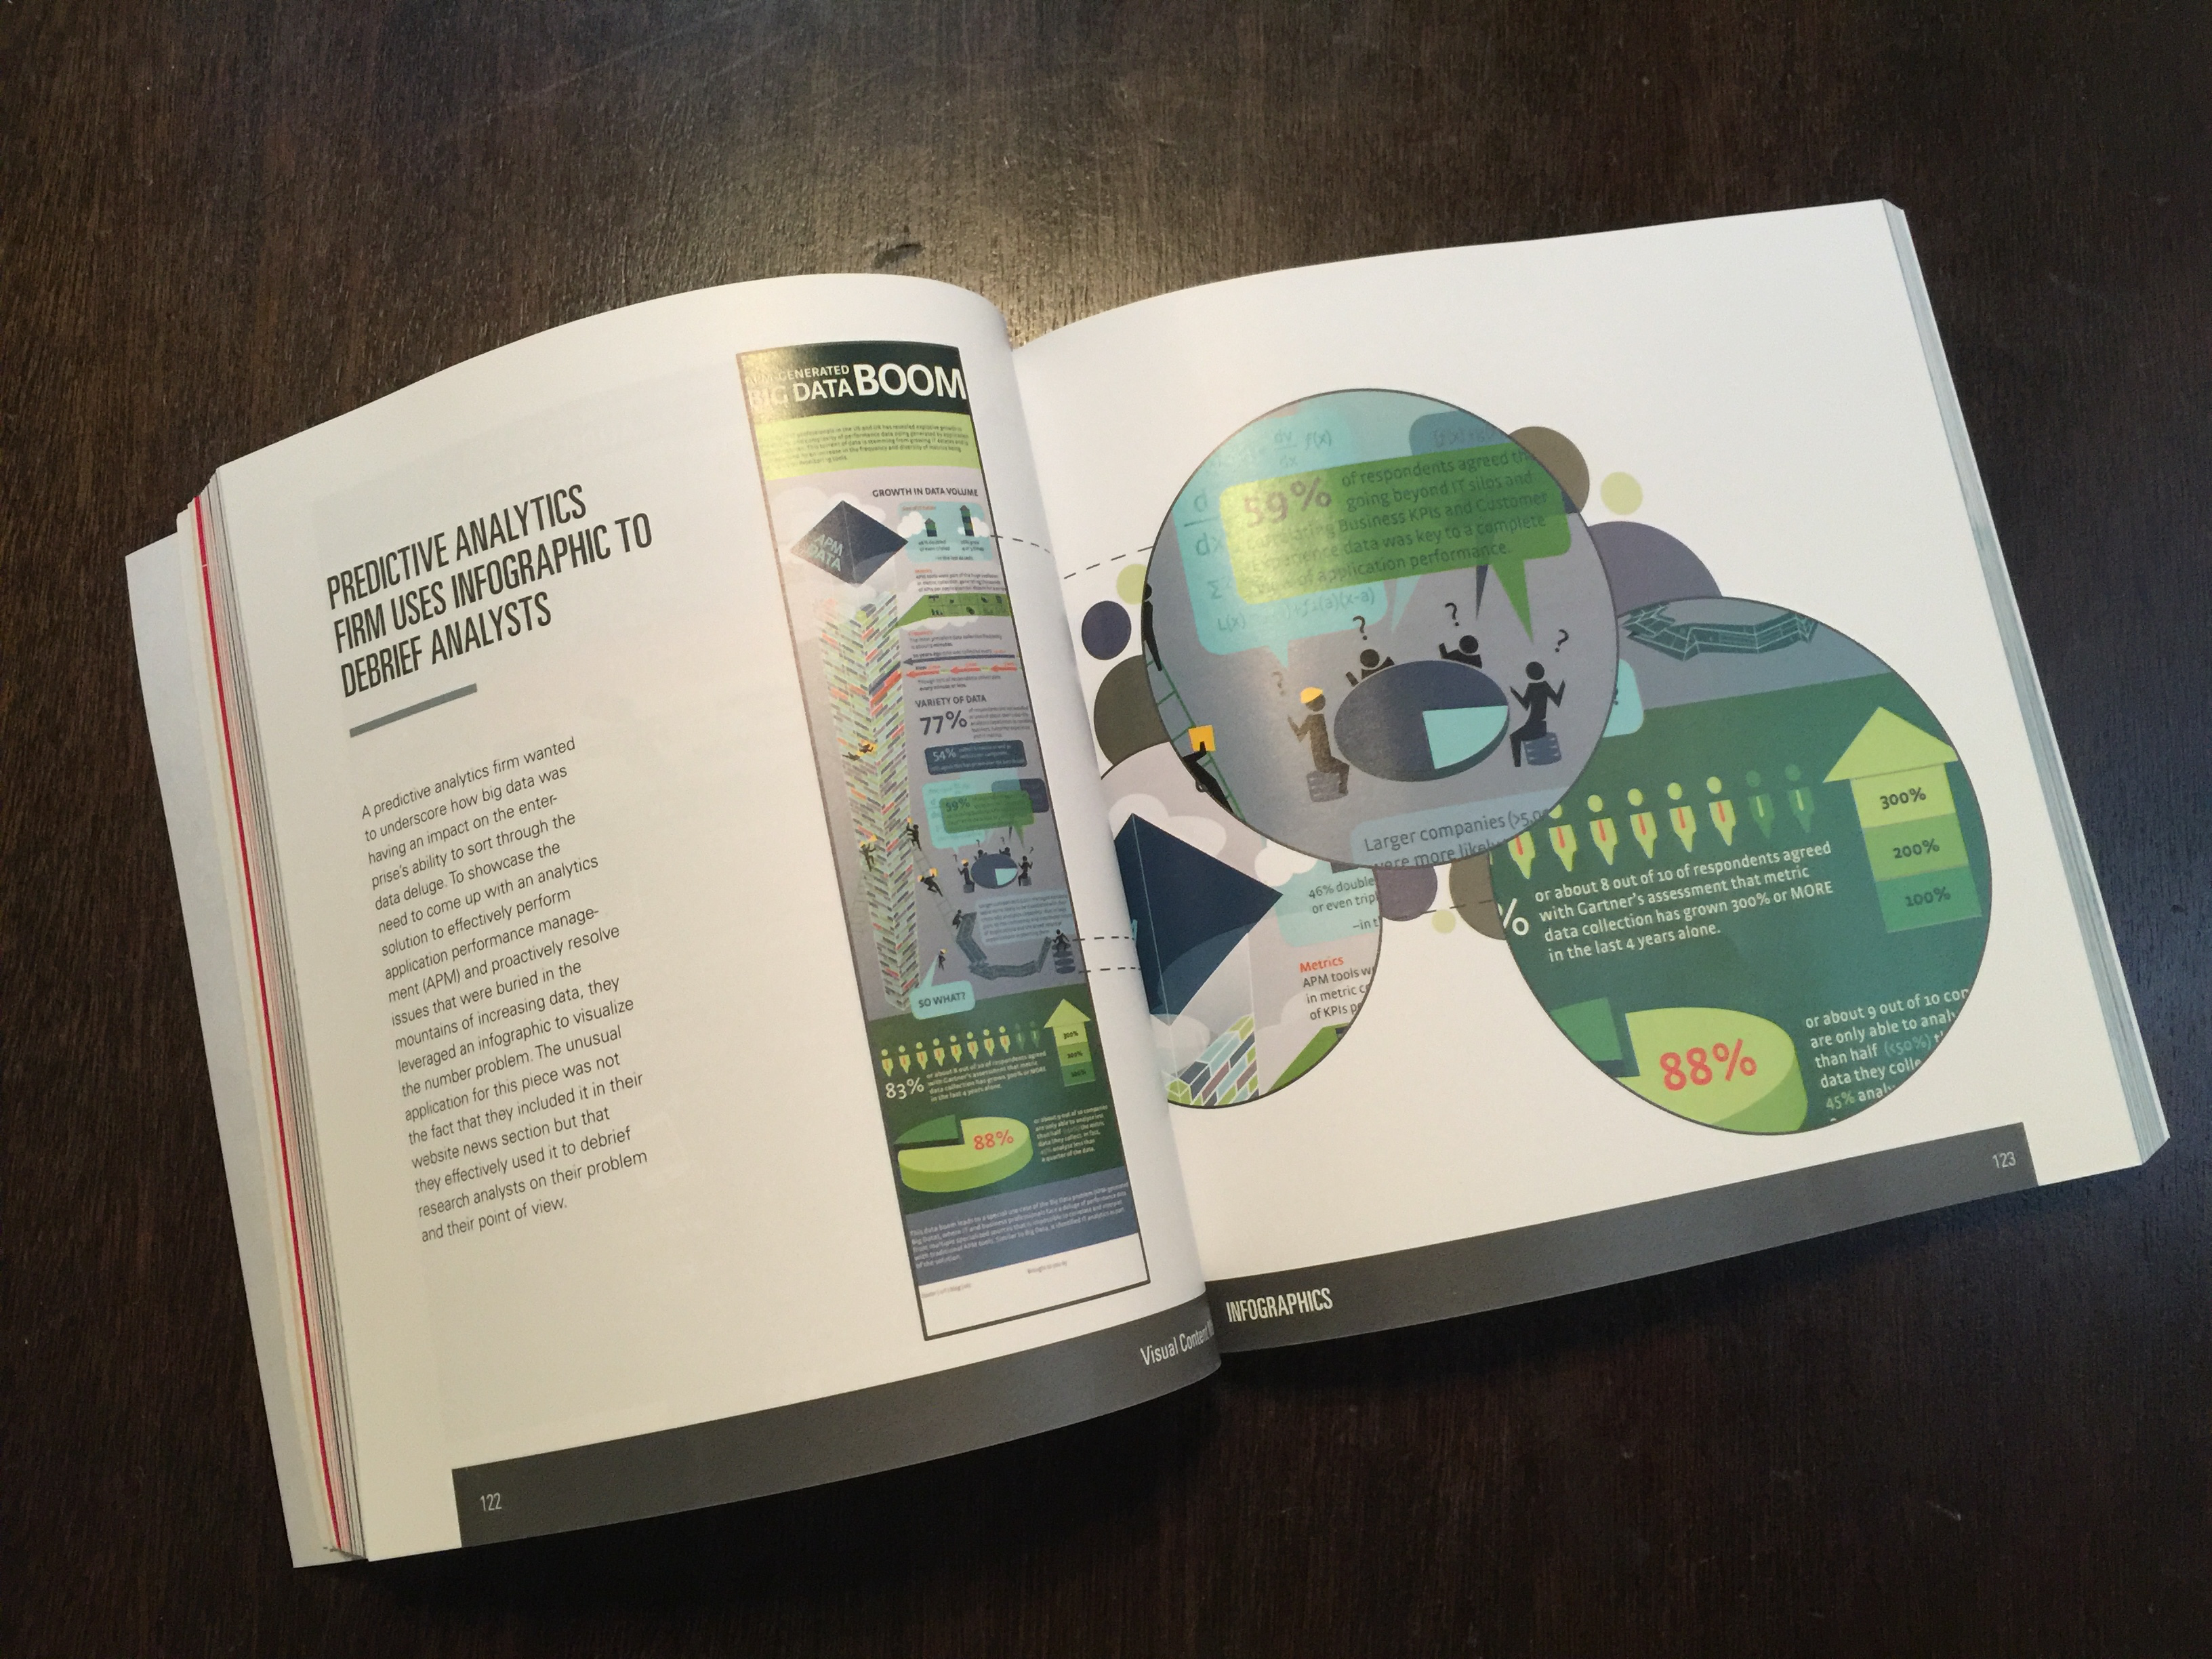
And then the final stage (after QA of course) is to make it on brand:
The Final Analysis
This infographic works well for several reasons:
- It immediately arrests the eye and engages with a question: “What is the magnifying glass focusing on?”
- It tells the numbers story in a playful way. The viewer gets to see the insights behind the number.
- It resets preconceptions. Viewers leave the infographic impressed with sense that the D-U-N-S number is more substantial than they previously thought.
- This infographic design makes the audience care about a subject that could be considered dry.
- It’s fun!
